Statistics on gender balance and diversity

Are you interested in statistics on gender balance and diversity in higher education and in the research sector in Norway?
This page contains statistics from Statistics Norway (SSB), which is responsible for statistics on the academic sector and the business sector. The statistics will be continuously updated.
Here you will find statistics on:
- Gender balance in scientific positions
- PhDs: Key figures
- Gender balance in the institute sector
- Statistics on diversity
- Researchers and social background
- Higher education
- International: She Figures
Gender balance in scientific positions
Gender balance among docent and professor positions
- 2025: 39 per cent female, 61 per cent male
- 2024: 38 per cent female, 62 per cent male
- 2023: 37,4 per cent female, 62,6 per cent male
- 2022: 36,2 per cent female, 63,8 per cent male
- 2021: 34,7 per cent female, 65,3 per cent male
- 2020: 33,5 per cent female, 66,5 per cent male
- 2019: 32,2 per cent female, 67,8 per cent male
- 2018: 31,1 per cent female, 68,9 per cent male
Docent and professor positions include university college professor (1012), teaching-oriented docent (1483), docent (1532) and professor (1013, 1404). Professor II is not included.
Sources:
The Directorate for Higher Education and Skills (in Norwegian)
Status report for higher education 2026 (in Norwegian)
The share of women
| Institutions | 2014 | 2016 | 2019 | 2022 | 2023 | 2024 | 2025 |
| NMBU | 21,2 | 22,5 | 25,5 | 30,2 | 31,1 | 32,4 | 34,5 |
| NTNU | 24,0 | 23,9 | 26,5 | 28,2 | 28,6 | 30,1 | 30,7 |
| OsloMet | 43,9 | 46,2 | 53,1 | 55,4 | 57,0 | 58,4 | 58,3 |
| UiA | 22,7 | 25,9 | 29,5 | 33,4 | 32,7 | 33,7 | 33,3 |
| UiB | 24,1 | 26,0 | 30,1 | 35,2 | 35,9 | 36,7 | 37,0 |
| UiO | 29,2 | 30,6 | 33,2 | 36,3 | 37,1 | 38,1 | 40,6 |
| UiS | 21,9 | 27,5 | 34,4 | 36,6 | 36,5 | 37,3 | 37,6 |
| USN | 25,3 | 28,2 | 29,5 | 38,8 | 38,2 | 38,9 | 39,0 |
| UiT | 32,6 | 32,9 | 38,2 | 43,1 | 46,4 | 47,2 | 46,4 |
| Nord University | 20,0 | 23,6 | 25,8 | 31,1 | 34,3 | 35,8 | 39,0 |
See more at the Status report for higher education 2026 (in Norwegian)
PhDs: key figures
2025
- 1878 persons defended their PhD-dissertation at Norwegian universities and university colleges in 2025.
- Gender balance in 2025: 884 of the PhD graduates were men and 996 were women.
- Altogether the dispersion between women and men among PhD graduates has been balanced since 2012.
- 2014 was the first year when more women than men graduated at doctorate level.
PhDs: subject field, gender and citizenship
- 41 per cent of the PhD graduates were of foreign origin.
- Female PhD graduates are in majority in the subject fields agriculture and sciences and medical sciences. In medical sciences 60 per cent of the PhD graduates were female.
- The share of men is particularly high within technology were male PhDs accounted for almost 67 per cent, but in mathematics and natural sciences female graduates accounted for 54 per cent.
- The share of PhDs with foreign citizenship is highest within technology and natural sciences.
Sources:
Status report for higher education 2025 (in Norwegian)
Database for statistics on Higher Education (DBH) (in Norwegian)
Flere doktorgrader innenfor teknologi, matematikk og naturvitenskap i 2023 (SSB) (In Norwegian)
Gender balance in the institute sector
- Among the researchers and academic staff who participated in research and development in the institute sector in 2020, 45 per cent were women.
- There are significant differences in the gender balance between different subject areas and institutes, where technology-oriented environments in particular have a lower proportion of women in the research staff compared with other institutes.
- Women are generally under-represented in top academic positions at research institutes, especially at technical-industrial institutes.
Sources: Gender balance in the instiute sector (NIFU Insight 2021:13) (in Norwegian)
Statistics on diversity
The statistics on the role of immigrants and descendants of immigrants in higher education and the research sector so far has been compiled for the years 2007, 2010, 2014, 2018, 2021, 2022, 2023 and 2024.
More about definitions
Statistics Norway categorizes the population into three groups:
- Immigrants: people who themselves have immigrated to Norway.
- Descendants of immigrants: people who were born in Norway to two foreign-born parents, and who have four foreign-born grandparents.
- The remaining population: people who are neither immigrants nor Norwegian-born to immigrant parents, i.e. people without immigrant backgrounds.
Diversity in research 2024
- The research staff consisted of a total of 39 645 people. Of these researchers, 13 906 were immigrants and only 296 were Norwegian-born to immigrant parents (25 4433 were from the rest of the population).
- 36 per cent of the research staff had an immigrant background, while the proportion in the population as a whole was 21 per cent.
- The share of research staff who were Norwegian-born to immigrant parents increased from 0.4% in 2007 to 0.8% in 2024.
- The universities and university colleges had the highest proportion of researchers/academic staff with an immigrant background; 39 per cent, followed by the institute sector with 35 per cent and the health trusts with 23 per cent.
- Just over half of the research staff in the natural sciences and technology had an immigrant background, compared with about 30 per cent in the humanities and social sciences and 26 per cent in medicine and health sciences.
Field of study by gender and background:
- The majority of the immigrants among the research staff are employed in academic communities in the natural sciences and technology. In this field are almost 60 per cent men and 40 per cent women.
- Most Norwegian-born to immigrant parents are in medicine and health sciences, while the number is lowest in the humanities and social sciences.
Country background/recruitment:
- The research staff in Norwegian academia have backgrounds from about 160 countries on all continents.
- Researchers from Germany made up the largest group with 4 per cent of the research population in Norway in 2024, followed by researchers from Sweden, India, China and the USA.
- In academia’s top positions, more than 80 per cent come from the Global North, while the distribution between the Global North and the Global South is about 50/50 among PhD candidates with an immigrant background, according to Statistics Norway's article (in Norwegian only).
- Statistics on diversity from 2018: The majority of the immigrant researchers, about 80 per cent, are internationally mobile researchers, who come to Norway with a higher education degree, and several also with a PhD degree.
Read: Being a foreigner is no advantage. Career paths and barriers for immigrants in Norwegian academia
Study conducted by NIFU in collaboration with the Work Research Institute (AFI) (2016)
Sources:
Statistics Norway (SSB, 2025)
Statistics Norway (SSB, 2023)
The proportion of immigrants in Norwegian academia continues to grow (NIFU Insight 2020:19)
Researchers and social background
In March 2024, Statistics Norway published statistics on class divides in the research sector for the years 2012–2022 for the first time:
- In 2022, 66 per cent of researchers had parents with higher education, a higher proportion than similar figures for students (60 per cent) and the general population (32 per cent).
- Age: The youngest researchers have the highest proportion of parents with higher education.
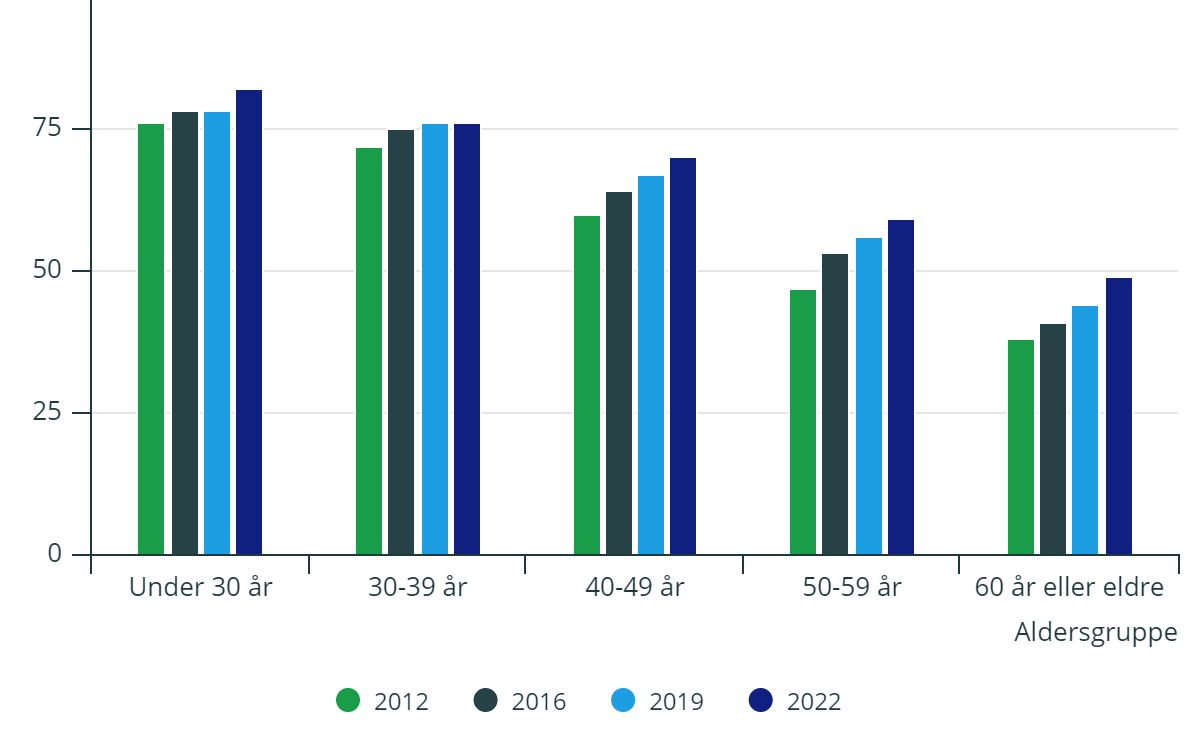
- For the institute sector, the proportion of researchers with parents with a higher education is somewhat higher than in the university and university college sector, with 68 per cent and 65 per cent respectively in 2022.
- Gender: The proportion of researchers with parents with higher education was similar to both genders, about 66 per cent in 2022. By comparison, this applied in 2012 to 55 per cent men and 59 per cent women.
- Researchers in medicine and health sciences have parents with the highest education.
- Institution: There are major differences between educational institutions: The highest level of education for parents is found at the university hospitals and the University of Oslo with 76 per cent, and lowest at Nord University with 51 per cent.
Higher education
- In 2025 the total number of students enrolled in higher education in Norway was 323 595.
- 40 per cent male and 60 per cent female completed higher education in 2025.
- While there is a high share of immigrants and Norwegian-born to immigrant parents in the areas of Science, Technology, Engineering and Mathematics (STEM), there is a low share of immigrants represented in the teacher educations in Norway
Proportion of students in the age group 19-34 years with different backgrounds:
- 26 per cent of Norwegian-born men with immigrant parents and 36 per cent of women were in higher education.
- For the rest of the population, the figures show that 17 per cent of men attended a university or college in 2023, while almost 27 per cent of women studied.
- Among those who have immigrated themselves, 10 per cent of men and 14 per cent of women studied at a university or university college.
Credits and graduations from higher education
2024-2025
- Women take more credits than men.
- Women accounted for 60 per cent of the completed programmes at bachelor's and master's level in 2024-2025.
- The proportion of women with a long education is approaching the proportion of men with a long education.
Sources:
Kjønn og aldersfordeling (HK-dir)(in Norwegian)
Status report for higher education 2026 (in Norwegian)
Statistics Norway (SSB, 2025)
Students in higher education
Credits and graduations from higher education (in Norwegian)
Completion rates of students in higher education
International
- Statistics and The report She Figures looks at women’s representation in academia in the EU countries. The report contains comparative statistics that also include Norway, and is published every three years:
She figures 2024 (Report, infographic and handbook)
She figures 2021 (.pdf) She figures 2021 (Infographic and handbook)
She figures 2018 (.pdf)
She figures 2015 (.pdf)
She figures 2012 - Gender in Research and Innovation, Statistics and Indicators (.pdf)
She figures 2009 - Statistics and Indicators on Gender Equality in Science (.pdf).
She Figures 2006 - Women and Science Statistics and Indicators (.pdf) - Ten years ago the European Commission started its activities on “women in science”. The report Stocktaking 10 years of "Women in Science" policy by the European Commission 1999-2009 records this ten-year history, analyses the activities undertaken, provides an assessment of their effectiveness and appropriateness.
More statistics
Statistics on diversity:
Previous editions were prepared in collaboration between Statistics Norway and NIFU, and published by NIFU. From 2023, Diversity in research will be prepared and published annually by Statistics Norway.
The Directorate for Higher Education and Skills has created a new page with gender statistics (in Norwegian only). Here you will find statistics on doctoral degrees, credits and foreign students by gender.
The Directorate for Higher Education and Skills was established in 2021, under the Norwegian Ministry of Education and Research.
Publications by the KIF Committee
Check out policy briefs and reports in English: The KIF Committee's publications.